In this article, debt cycles, credit and interest rates are explained in detail with charts. Learn debt cycle stages and how to use them to your advantage. Discover investing possibilities in the debt cycle.
Our economy works in cycles and these cycles are mainly driven by debt. The debt is created by taking credit and credit can help you or harm. But you can choose the side.
In this post, you will find short-term and long-term debt cycles explained. Furthermore, you will discover a possible future trend of the current debt cycle.
By understanding debt cycles, credit and interest rates you can always position yourself better in the cycle. Besides that, this education can help you start to invest and save for the future. Understanding of debt cycles is a must for every entrepreneur or a small business owner.
If you are not sure what are you doing on this page, visit 6 reasons why it is worth learning the basics of the economy.
Credit and Debt
Have you ever thought about debt, credit or interest rates? Do you know anything about them? Most people don’t. But they should.
Credit is the most important part of the economy and usually, nobody cares about it, nobody understands it and most people have too much of it.
By taking credit, you get the money that you can spend today, but you promise to pay it back later with an interest.
When somebody takes credit, at the same time they create debt and debt must be always paid back. Thus, the debt is an asset for the bank (or lender), but liability for the borrower.
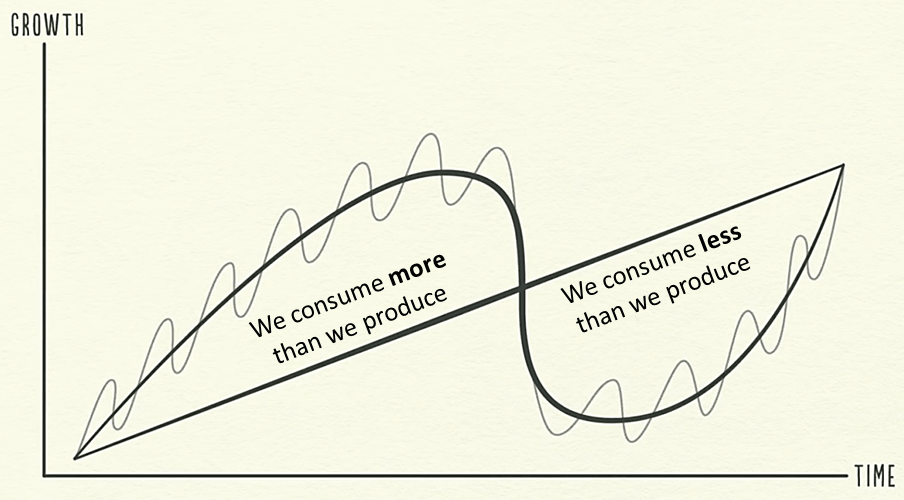
In short, credit allows us to consume more than we produce when we take it. With credit, we can start or expand our business, buy a house or create new workplaces and thus increase the growth of the economy.
On the other hand, we can take credit to buy some consumables that do not make us more productive, such as a new TV or Xbox.
By taking credit, we steal from ourselves in the future. It is because at the time we take credit, we can consume more than we produce.
Unfortunately, there is a time, when we have to pay the credit back and we have to produce more than we consume. Of course, this period is painful.
Facts about Credit
- Credit allows us to consume more than we produce
- It should be used ONLY to increase our productivity
- By taking credit we steal from ourselves in the future
- When you take credit, you create debt
- Debt must be paid with interest
We should always reduce the number of liabilities we have
In other words, we should use credit only to make us more productive. For example, if I take credit to buy a new tractor – it is an investment. The tractor will help me to be more productive, it will help me to plant and harvest more plants, thus increase my productivity.
However, if I take credit to buy a new and expensive car, that I would only use to impress other people that I don’t even know, doesn’t make more productive. Instead, this car would be liability to me.
Debt Cycle Theory
Because we take credit, at the same time we create debt. Furthermore, it causes fluctuations in the economy. Fluctuations are unavoidable because of human nature and this is the main reason why the economy has debt cycles.
It is of utmost importance to understand debt cycles because you can’t avoid them. They have a huge influence on our all lives, and basic economic education can help you to thrive at any time of debt cycle.
To understand debt cycles better, look at the graphs below.
The first graph on the left is productivity growth. It also has a cycle, but the cycle is long and it doesn’t fluctuate too much in the short-term. Productivity is simply Gross Domestic Product (GDP in dollars) divided by our working hours spend, to create those products and services that were sold to generate GDP.
Our productivity grows because we use more advanced tools, computers, more sophisticated software, robots and so on.
Center graph and the right graph show debt cycles. These are short-term and long-term debt cycles. While the short-term debt cycle takes around 5-8 years to swing, the long-term debt cycle takes around 75-100 years.
This is exactly how the economy in the world works – in cycles.

Short-term Debt Cycle
Now, look at the graph below where all three cycles shown above are combined into a single graph.
For instance, those small swings on the curve are short-term debt cycles. This cycle is also sometimes named the business cycle. The short-term debt cycle usually lasts about 5-8 years.
You can easily use this cycle to your advantage by investing accordingly. For example, the nominal value of the real estate, stock market, gold and silver swing with economic cycles.
In 2008, the housing price bubble in the US exploded (not only in the US) and the short-term debt cycle reverted. Now, more than 10 years passed after the last recession the cycle is about to revert again.
This graph above is by far the simplest way to understand our debt-based economy. Nowadays, governments can print as much currency as they want, since the gold standard was abandoned in 1971. Currency is not backed by gold or anything else and can be easily created out of thin air as credit.
Interest Rates and Their Importance
Before talking about the long-term debt cycle the interest rates must be understood.
When somebody takes credit, at the same time debt is created and it must be always paid back. Moreover, by paying the debt we also have to pay an additional cost of borrowing money that is called “interest”. Interest size is regulated by Central Banks.
Interest rates (or fed funds rates in the US) – is a percentage that bank takes when it gives you a credit. For example, if you borrow $100 with an interest rate of 5% you will have to give back $105 or simply 5% more than you borrowed.
In short, interest rates define how cheap credit is. Central Banks control interest rates and vary them as needed.
Usually, Central Banks increase interest rates when the economy grows (to slow down borrowing) and decrease them when spending slows down (to increase the growth of the economy).
Low interest rates makes credit cheap
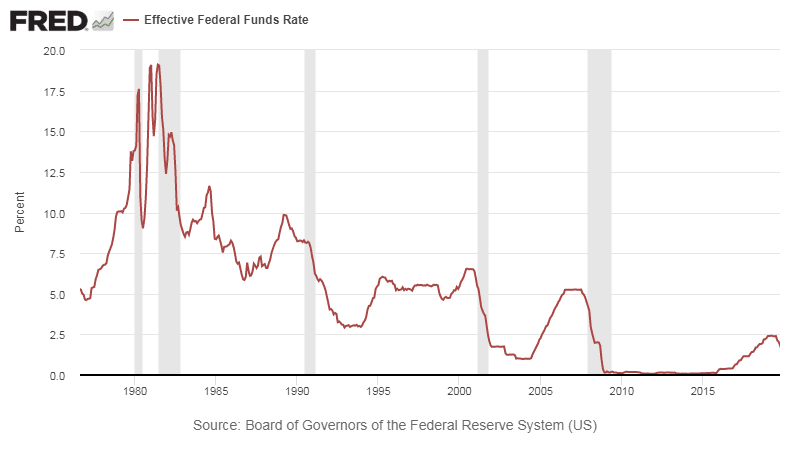
The graph above represents interest rates set by the Federal Reserve in the US. Shaded areas represent recessions in the US. Just before each recession, the FED starts to lower interest rates and keeps them low for a few months. It makes very good credit conditions for everyone, thus people start to take more credit and the economy starts to grow.
However, if good credit conditions stay for too long, people take as much credit as they can. It inflates asset prices and the stock market. Furthermore, real-estate prices start to rise together with the rent.
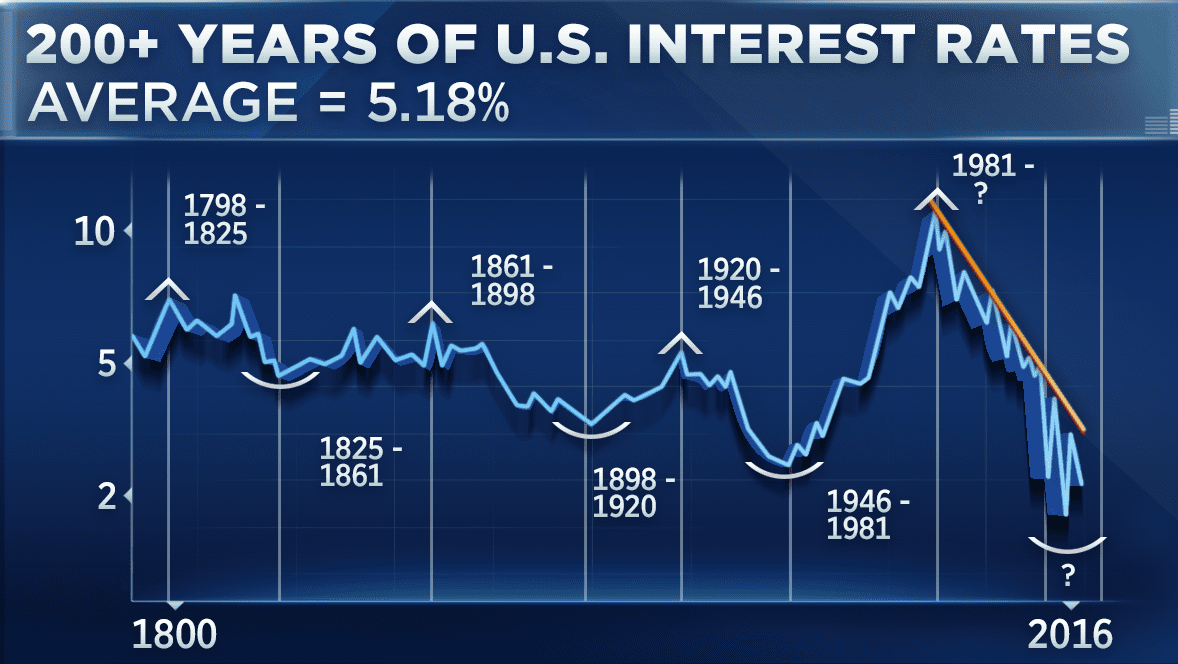
The graph below shows more than 200-year of interest rates in the US. We currently have the lowest interest rates in history! The short-term debt cycle is about to reverse.
Long-term Debt cycle
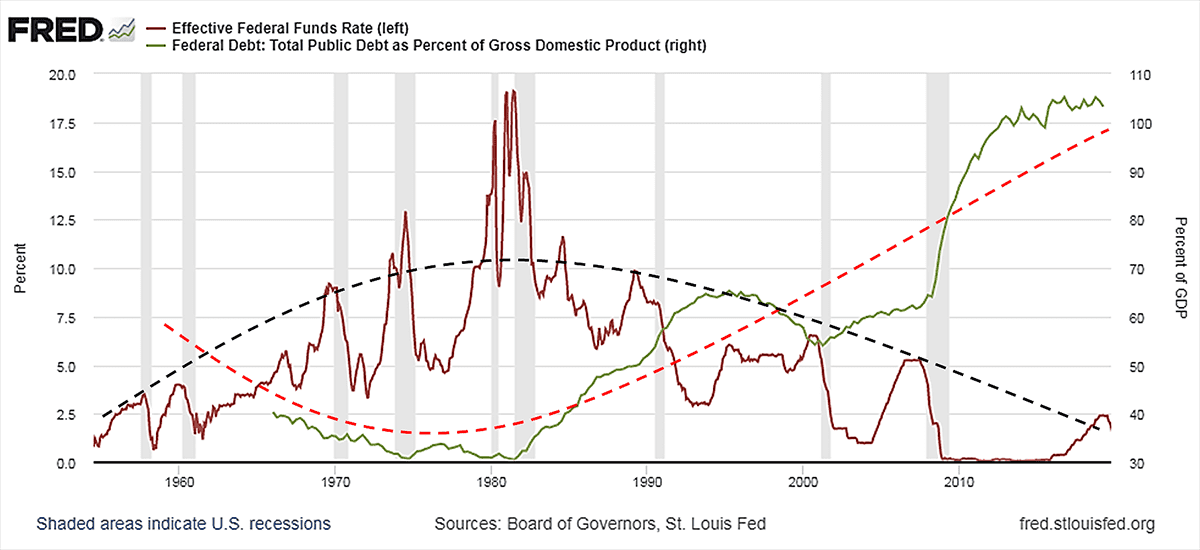
Look at the graph below. The public debt is almost exactly the reverse of the interest rates. This long-term debt cycle lasts about 75-100 years.
If we would zoom in only the last 60 years of the interest rates (dark red line), and on top, we would add public debt as a percent of GDP (green line), we would get the following graph.
When interest rates started to be lower and lower, debt started to rise and have risen since. Currently, interest rates in the US are below two percent, while in Europe and Japan they are at zero percent.
In the graph below we can clearly see that debt swings opposite to the interest rates because credit is cheap. With cheap credit, the public has more and more debt, because debt at the same time increases asset prices. I also added black and red dashed lines to show the swings.
The end of the long-term cycle always comes with depression. A term depression is a long-term downturn in economic activity. Moreover, this cycle usually ends with huge political and economic changes around the world.
Last time, the long-term debt cycle reverted in 1929 and as a consequence caused the Great Depression, stock market crash and many other events.
At the same time, the reverse of the long-term debt cycle brings the biggest investing opportunities in your life because certain assets will increase in their nominal value in a short period of time.
Debt Cycle in Reality
I know that theory is good, but let’s apply it in practice. As an example, I took the economy of the US, because it is the biggest economy in the world and has a huge influence on all other economies.
Take a look at two graphs below that compare theory with reality. The graph on the left shows the data in the US. Do you see any similarities? The orange line represents GDP and the red line represents total public debt.
It is important to mention, that data in the graph on the left is indexed in the last quarter of 1970. In short, the value of both graphs is set to number 100 at the end of 1970. It allows us to see how public debt as a percent of GDP grew from 1970.
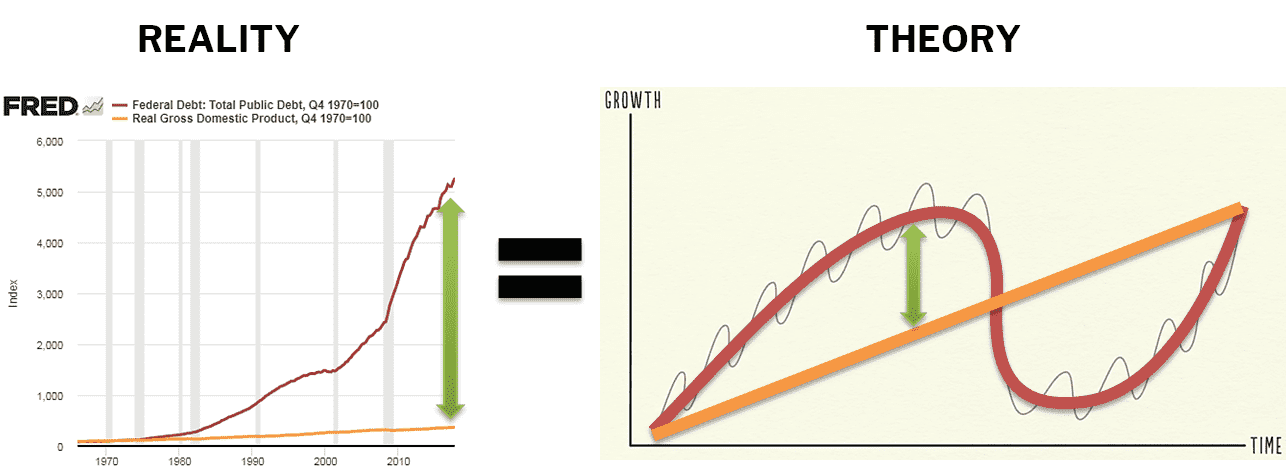
The dark red line in the graph above is the long-term debt cycle while the orange line is GDP. The short-term debt cycle can be only slightly noticed in the red line in the graph on the left. Moreover, the data of other economies in the world look more or less the same.
Luckily, I found the following graph. The lines in the graph represent debt as a percent of GDP. Look at it, public debt swings in cycle and we are again at the top of the cycle. By the way, this graph shows data only up to 2014. From then, governments made even more debt!
What do you think, how much more debt can we create before the whole economy collapses and we will enter economic depression like in 1929?

Do you want to know the public debt of your country?
You can observe it in real-time at the debt clock.
U.S. national debt in real-time – U.S. debt clock
National debt of other countries – World debt clock
Conclusions
Debt cycles are very simple. They repeat and repeat themselves hundreds of years. Because we can’t avoid them, we should take advantage of them. For example, the nominal value of various assets, real estate, gold and silver vary with the debt cycles.
Also, the best conditions for credit are just after the recession ends. At that time it can be smart to invest in real-estate. However, credit should be used only to make us more productive or for investing purposes.
Currently, interest rates are at their lowest in our history. Moreover, they are about to reverse soon. Such levels are not sustainable and lead to huge changes in the financial system.
At the same time, it brings the biggest investing opportunities in our life-time which will not repeat until the end of the century. For this reason, it is important to understand debt cycles and take advantage of them today.
Want to learn more about debt cycles from best investors?
Ray Dalio is one of the most successful investors in the world. His book Principles for Navigating Big Debt Crises presents debt cycle stages, how and when they occur. If you are interested to learn more about debt cycles in the economy and our current position on the debt cycle, I would suggest for you to read this book.
The PDF of this book is FREE and you can download it directly from Bridgewater Associates
PDF book – Ray Dalio: Principles for Navigating Big Debt Crises
You can get Hardcover of the book on Amazon:
US – Ray Dalio: Principles for Navigating Big Debt Crises